2023-10-07
This week, I had the pleasure of reading "Chaos Kings," a fantastic book that I highly recommend to anyone interested in a thought-provoking approach to modern portfolio theory. One of the book's highlights is the intellectual battle between the contrasting ideas of Nassim Taleb and Didier Sornette, involving their concepts of Black Swan and Dragon King. Within the book, the author also references a paper titled "Predicting Economic Market Crises Using Measures of Collective Panic" by Yaneer Bar-Yam.
In this post, I'd like to delve into this paper, which I found on arXiv, and attempt to provide a simplified explanation of its key concept.
Yaneer Bar-Yam discusses the occurrence of crashes or panics and explores methods to predict them. He categorizes these events into two broad categories: economic crashes, which are external factors like bank runs, and sociological crashes, which are internally driven by collective actions often triggered by perceived threats, whether real or imagined.
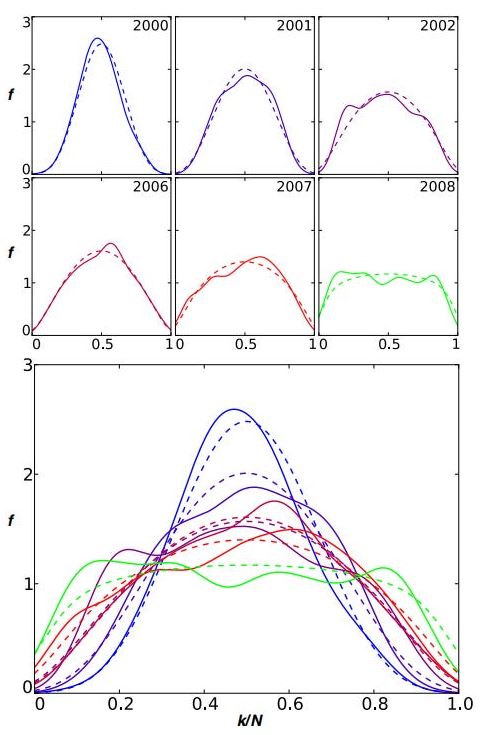
One of the key indicators he uses to gauge the potential for a sociological crash is the correlation in the movement of stocks. Specifically, he observes the fraction of stocks that move in the same direction. This correlation tends to increase leading up to a market crash.
Yaneer Bar-Yam's approach essentially boils down to closely observing how stocks behave collectively as a means to foresee sociological crashes in the market. These crashes typically stem from shared behaviors and responses within the market, often sparked by perceived threats or internal factors. By meticulously tracking the extent to which stocks move together, this analytical framework offers deep insights into grasping and, crucially, predicting market turbulence.
The observed trend over the past decade reveals a significant decline in the curves, indicating that a majority of stocks are increasingly likely to move in the same direction, whether upward or downward, over the course of a year. This is a departure from the situation in 2000 when roughly 50% of stocks moved up or down independently. Notably, co-movements among stocks have seen a remarkable uptick during this period.
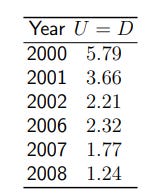
If we were to calculate the kurtosis for each of these curves and aggregate them into a single value represented as 'U', the resulting pattern should resemble the one depicted below.
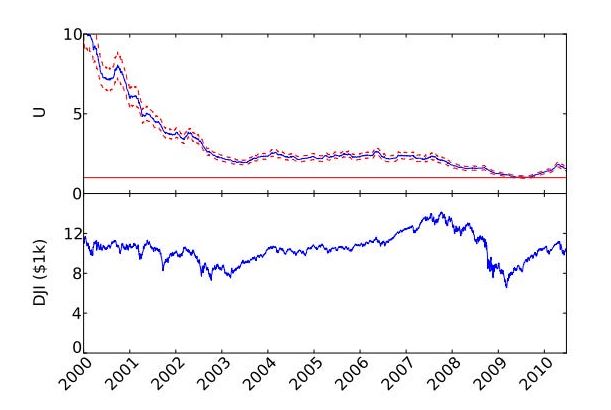
When we extend the timeframe over which we estimate 'U' and plot its values, a pattern emerges. Specifically, when 'U' equals 1, represented by the color red in the chart, it signifies a critical point of vulnerability. This chart shows that 'U' began to decline starting around the Mid 2007.
By applying this model to the period spanning from 1985 to 2010 and assessing the relative change of 'U,' we made some notable predictions. Specifically, the model successfully forecasted 8 out of the 20 largest crashes within this time frame. 10/19/1987, 10/26/1987, 10/27/1997, 9/17/2001, 9/29/2008, 10/9/2008, 10/15/2008, 12/1/2008
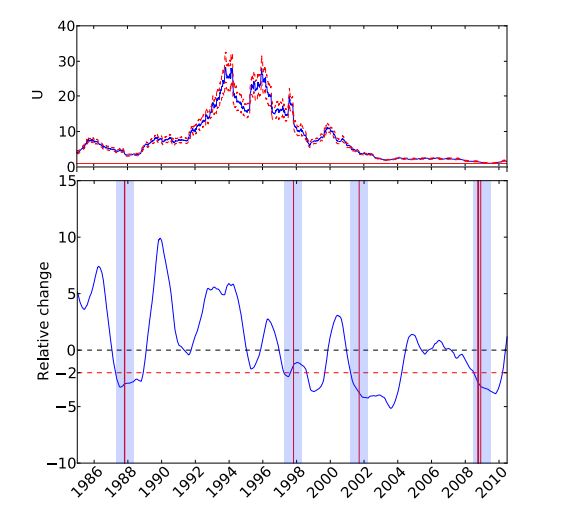
The significant decline in the DJI on September 17, 2001, immediately following the tragic events of September 11, is commonly attributed to an obvious external factor. However, it's crucial to recognize that such market movements may also be influenced by inherent dynamics within the market itself.
While conventional wisdom often associates volatility with market risk, the approach presented here, focusing on the measure of collective following, introduces an alternative. It proposes that this particular measure could offer a more dependable means of predicting market crashes. In essence, it suggests that understanding how stocks collectively respond and move together might provide a deeper understanding of market behavior, surpassing the predictive capabilities of traditional volatility metrics.
For anyone that wants to read the paper: https://arxiv.org/abs/1102.2620
Thanks
Finn